
Introduction
The assumptions we make about the way the world works often go unchecked. We rely on extrapolation and some logic to lead us to conclusions that seem reasonable, but in actuality, the counterfactual might be just as likely. This quarter we have developed some of the data analytics skills to delve into the data we need to check our assumptions and perhaps event form new beliefs about the world around us.
In this paper, we will examine whether income is a reasonable indicator of one’s political party identification. For example, is it true, as is commonly believed that those who earn at the top income levels will be strongly motivated by economic factors (namely, paying less in tax) and therefore be driven to vote for the party classically thought to be anti-tax? Will this lead them to identify with the Republican party? Similarly, are those who earn at bottom income levels more likely to support the party which is believed to support welfare programs and general wealth redistribution? Will they identify with the Democratic party? The answer to this question has the opportunity to reaffirm some of these common assumptions and provide the necessary context in which to understand them, or it may lead us to reevaluate how we think about the role of income as a predictor of Party ID.
Using data gathered in the United Staes we will evamine this question and formulate a hypothesis, test this hypothesis, and reach a conclusion on this issue. In order to achieve this, we will first need to decide exactly what the research question is. As we want to know about the relationship between income and party ID, we will focus on one level of each. We will explore weather higher income leads to more identification with the Republican party.
In exploring this question, the income ladders we use will be important as they will form the basis of the research model. Using broad low, middle, and high income levels backed by specific dollar amounts we will be able to effectively categorize respondents into the necessary groups. These dollar amounts will be defined further on. This will be coupled with a Democrat and Republican identifications. As the goal is to use a Binary logistic regression, we will exclude independents, though this is something that could be added in the future for further analysis.
Prior to examining the literature we can briefly discuss some preliminary thoughts about the question. I expect to see the literature describe a relationship that people with higher income tend to identify more with the traditionally conservative parties or those which avoid taxation. Those with lower income will likely support more left leaning or socialist parties. This is because of the typical assumptions we make tell us that people concerned with economic policy advanced by a given ideology party will be supported by those whom it affects the most. People should, if rational, support the policies which stand to do them the most good. This is the foundational idea behind voting your interests, and it is not just expected, it is a pilar of the democratic process.
Literature Review
I will be examining income as a predictor of party Identification. I expect to see a result that people with higher incomes are more likely to identify as Republicans, while folks with lower incomes are more likely to identify as Democrats. To begin this research, I have identified three research articles and will summarize their question, theory, methodology, and conclusions.
Political Polarization and Income Inequality
Researchers in this article set out to explore the relationships between “income and voter partisan self-identification”. While examining the stratification of income and party Identification, the researchers found that there was an increase in id stratification based on income over the time period explored. This is due, argue the researchers, to an increase in ideological polarization surrounding economic issues, and is largely not an issue of inequality. Using 195 – 20020 National Election Studies (NES) Data these researchers utilized the partisanship seven-point scale, a custom generated income assessment based on census income breakdowns by race, and control variables: race, region, gender, age, and education.
The researchers explain that due to the nature of the party ID variable “ordinary least squares is a highly inappropriate way of estimating our model” and opt to use an ordered probit model instead. The researchers found that was indeed a statically significant factor in the level of Party ID, however that the overall effect was very small. For example, when you doubled the average income the republican partisan effect was “…only 0.139 larger than an individual with an average income”.
There are many aspects of this paper that I can replicate or draw from, including the post model analysis. This article is by far the closest of the three I will outline here in terms of my original paper topic, with the exception that this paper employs a historical analysis spanning five decades, whereas I will examine a moment in time from the most recent data available. (McCarty, 2003)
Self-Interest, Economic Beliefs, and Political Party Preference in New Zealand
In this article, researchers developed their own survey and distributed it within New Zealand. The goal of the survey was to determine their party preference and income levels in additional to asking respondents about a number of economic issues. One thing to note here is that their sample sizes for this article when broken down into the four major parties can be perilously small (ACT respondents measuring 24).
The result here was that centrist parties such as ACT hold much more room for a diverse spread of economic beliefs, while those which are more ideological extreme in one direction, or another are more uniform among their supporters. Additionally, the findings based on income level alone were consistent that the higher income earners were more likely to identify with traditional right-wing parties, or those parties which had conservative economic agendas.
This article seems to have some issues, and in terms of supporting my project, this doesn’t have a lot of empirical knowledge for me to use, especially since the data was generated independently, and being a different political system, multi-Party proportional representation, most of this will not be replicable on my paper. However, the findings are quite interesting, and I will hopefully be able to replicate the analysis of diversity of economic beliefs to see which US party allows for more. (Allen, 2000)
Political Party Affiliation and the View Toward Income Taxes at the State Level
This article set out to determine if it was consistent at state levels whether democrats were less opposed to taxes than republicans. This was in part created due to the republican claims that democrats are the party of high taxes. Is this a national phenomenon though?
The researcher used a very simple methodology and compared the presidential voting outcome with states income tax rates. As an aside, I see upfront some issues with this as some states common law make it illegal to impose a state income tax and other states employ other primary taxes and use sales or property taxes (examples of Washington or Florida respectively can be useful here). This article does not take this into account with its overly simplified model. The result is that marginal tax rates are not significantly higher in Democratic states (or at least those that went for a Obama in 2012).
While not intending to be rude, this article is most helpful in determining what not to do in my paper. The analysis is very vague and seems to be based on non-explanatory variables and secondary explanations. For example, using which candidate the state vote for at the national level, rather than political control of the state legislature or executive as these are likely much more relevant to setting state tax policy. (McGee, 2014)
Theory and Hypotheses
Having reviewed the literature and considered the theory, my hypothesis, as I have alluded to throughout this paper, is the higher income levels will correlate with higher identification levels with the Republican party. The theory behind this is that people that care more about tax policies commonly associated with the republican party will be the people most affected by these decisions and therefore those with the highest incomes. This theory is generalizable to the entire population as the ANES is representative of the US as a whole. We should see that an increase in income correlates directly to an increase in republican identification in Exp(B).
I also expect that age and region will have a significant in pact on ideology as these tend to be enclaves of similar ideologies and therefore likely also party identification. For example, the American South tends to have much more pervasive conservative ideology and it seems that there are greater number of Republican voters in the South.
If my hypothesis tends turns out to be true it is likely because the theory behind it is also correct and that people are voting in their economic interests focused mainly around tax policy. If it turns out to be true parties could use this information to better structure or advertise tax policy to ensure maximum support for these policies at each income level.
Methods and Data
In order to answer whether income really is an indicator of party ID, I will analyze data from the 2020 American National Election Study (ANES) comprised of 8280 responses. This is the richest dataset and includes many fascinating variables which will be helpful for analysis. It also has a large number of respondents, which is highly desirable.
The most important independent variables I will be using is income (V201617x), which is a categorical variable. I will create dummy variables at low ($0-$39,999), medium ($40,000-$99,999), and high (+$100,000) income levels. V201617x is a summary of the restricted questions preceding it and was generated after the survey to protect respondents privacy and to simplify the usage of the data. My analysis will be relative to a low-income household in order to clearly see any potential increase in Republican identification at any increases in income level. Responses not in these blocks will be coded as missing data and ignored in this analysis. Respondent by income are as follows: Low Income – 2368, Middle Income – 2831, High Income – 2465. With over 2000 responses in each income level results should be significant at this level unless our controls effect some other factor. Basically, we should have enough people for this analysis.
My main dependent variable is party ID (V201228). This will be a categorical choice where responses are either Democrats (coded as 0), or Republican (coded as 1). Because of this, I will be using a binary logistic regression and will use exponentiated Bs and a .95 confidence interval. We will see the Exp(B) show increases or decreases in log odds of identification with the target group (in this case Republicans), and if our hypotheses holds we should see these increase together.
I will be including four additional independent variables as controls in my model which may influence party ID. I have limited the control variables to these four as they seem to be important for the analysis, however other combinations may find more significant (or possibly less significant) results. The first will be age (ANES 2020 variable: V201507x). As an ordinal variable I made a new variable excluding non-responses and preserving all existing age data. There were 7932 responses for age ranging from 18 to 80 with a median of 52. This control will be important as people tend to reach peak earnings in later years. Income can also be lower after retirement, so the inclusion of those likely out of the workforce is important.
Second will be region (ANES 2020 variable: V203003). I will also control for region on a four region divide in the United States. I have created dummy variables for South, Midwest, and Northeast with a reference category of West. This will also be important as incomes vary by region and state. For example, with California’s large population and high average income when compared to the south it is possible that this could skew the data if not accounted for, so this is also important.
Third is gender (ANES 2020 variable: V201200). It is a classic control mechanism in data research and controlling for gender can help us combat any wage gap issues. It could also address issues related to financial equality of women which may seem less relevant than 100 years ago.p
Fourth and finally is a control for education (ANES 2020 variable: V201511x). I will control for education and will create three dummy variables. HS Only, College, and Graduate and Beyond. I will exclude all other categories and non-responses as system-missing data. Education should be a primary driver of income, and therefore will likely be an interesting and relevant variable.
Results
 My goal has been to examine whether income was a predictor of party ID in the 2020 election. My hypothesis, which is based on the literature and on intuition, I expect that a higher income will result in a greater chance of identifying as a republican.
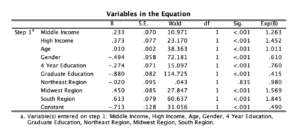
All variables with the exception of those in the northeast region are statically significant. The model does show that an increase in income does indeed lead to an increase in the likelihood that an individual identifies as a Republican. A 26% increase for middle income relative to low income and 45% high income relative to low income. Similarly, age has a positive effect on Republican identification with a one year increase in age correlating to an 11% increase in log odds of Republican identification. Females log odds of identifying as a Republican decrease of 39% relative to their male counterparts. Education across the spectrum decreases identification with the republican party, 24% for BA and 59% for MA relative to a HS grad. Living in the South increases the likelihood 84.5% and Midwest increases the likelihood 56% relative to someone who lives in the West.
As noted, the northeast region is not statistically significant and will therefore not be included in this analysis. I do not have a clear idea of why the Northeast is not statically significant while the other regions are. It might be because those in the northeast respond similarly to those in the reference category (those in the West).
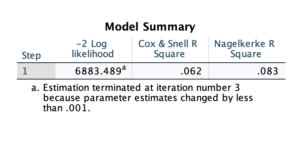
There is a statistically significant relationship between my independent and dependent variables and it is in the direction that I expected. This shows clearly that the higher someone’s income level the more likely they are to identify with the Republican Party. This confirms my hypothesis. Further, my -2 Log likelihood is within normal parameters and should therefore be seen as significant.
Discussion and Conclusion
So, the data clearly shows that people in middle- and higher-income groups have a greater chance of identifying with the Republican Party similarly folks who are older have a slightly higher chance and those in the Midwest and South have greater chances still. All but one of my categories was statically significant. All of this seems to track with the literature on the topic as well as my stated hypothesis. The conclusion we are left with is that my hypothesis was largely correct and that indeed people with higher income will identify more strongly with Republican Party. Similarly, those with lower income will identify more with the Democratic Party.
Future research may want to control for other factors such as ideology however the relationship between ideology and party idea is strongly noted, and likely this would result in a serious dilution of the results. Future researchers might also want to account for industry type as earners who make higher incomes in professional industries might be more likely to identify with the Republican Party as compared to people in more nontraditional employment who also earn at higher levels. Lastly an analysis based on race would be an interesting addition to future studies on this topic as this is also strongly related to people’s party identification. This would help to identify whether income is a driver or merely an indicator of party preference.
I found this to be an interesting research topic and one that confirmed a long-held beliefs that I’ve had. It provides background rooted in data to show that people do tend to vote in their own interests. I believe this to be a good thing and as stated previously a hallmark of democracy. It is irrational voting and voting without justified reason that poses a greater danger than that posed by people voting within their own economic interests. Personal hero of mine Voltaire once noted “Those Who Can Make You Believe Absurdities Can Make You Commit Atrocities”. The conclusion of this research project reaffirms to me that many voters still seem to be acting in a rational manner and it dispels some of the fears that I might have otherwise had if the results had been different.
Bibliography:
- McCarty, N. M., Poole, K. T., & Rosenthal, H. (2003). Political Polarization and Income Inequality. SSRN Electronic Journal. https://doi.org/10.2139/ssrn.1154098
- Allen, M.W. and Hung Ng, S. (2000), Self-Interest, Economic Beliefs, and Political Party Preference in New Zealand. Political Psychology, 21: 323-345. https://doi.org/10.1111/0162-895X.00190
- McGee, R. (2014), Political Party Affiliation and the View Toward Income Taxes at the State Level. SSRN Electronic Journal. https://papers.ssrn.com/sol3/papers.cfm?abstract_id=2410215